ROI Overview
Introduction
Use the Region of Interest (ROI) options to calculate the average density and the standard deviation of that ROI. You can perform ROI measurements on an image with the following ROI types: rectangular, elliptical, polygonal, freehand, and auto detected (2pt).
ROI Measurement Considerations
When you create an ROI annotation, Synapse automatically calculates the average density of the ROI annotation. The resulting calculations use the pixel values of the displayed image. If the displayed image is Wavelet (lossy) compressed, the pixel values within a ROI might be different from the pixel values within the same ROI in the original version of that image.
Therefore, the mean and standard deviations of the ROI using the wavelet compressed image are likely to be different from the results calculated if the original image was used. Be aware of these ROI differences.
The following indications display when viewing mean (M) and standard deviation (SD) values on a wavelet compressed image:
- SD: ~234 or M: ~456 - Indicates the value is approximate and different from the calculation of the original
Synapse hides the SD, M, Min, Max, and density values for images for the following reasons:
- If an image does not contain both tags rescale slope and rescale intercept.
- If an image displays in color (not monochromatic).
A tilde (~) displays before a value if the image quality is degraded. This includes the image pixel data and if the image's Lossy Image Compression tag (0028, 2110) has a value of 01.
|
Note: |
Synapse annotations do not use padded pixels for their results. Padded pixels will not be included for SD, Max, Min, and Mean calculations. |
ROI Measurements
ROI measurements can include any of the following:
- Area - Defined in square inches, square centimeters, or square millimeters.
- Perimeter - Defined in inches, centimeters, or millimeters.
- Mean - Calculated as average density (digital) value within the area of the ROI.
- Standard Deviation - Calculated from all density values within the ROI area to quantify the extent of the digital value variance.
- Maximum Value - Defined as the largest density value within the ROI.
- Minimum Value - Defined as the smallest density value within the ROI.
- Length
of Major Axis - Defined as the longest line that connects the
most distant points on the edge of the ROI.
- For Elliptical ROI or a circle, the longest line is the largest diameter.
- For 2-Point, Freehand, and Polygon ROI, Synapse uses the two farthest points as the length of the major axis.
- Length
of Minor Axis - Defined depending on the type of ROI:
- For Elliptical ROI or a circle, the shortest line is the smallest diameter.
- For the 2 - Point, Freehand, and Polygon ROI, Synapse uses the longest linear dimension that is completely in the ROI and is perpendicular to the major axis length.
Note:
Synapse does not calculate the minor axis length if the major axis length is not fully contained within the ROI, such as a crescent-shaped ROI.
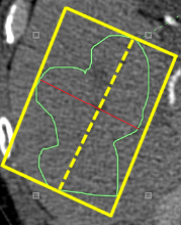
- In the example below, the Major axis is the longest linear dimension of the shape of the ROI shown as a yellow dashed line.
- The Minor axis is the longest linear dimension within the shape of the ROI that is perpendicular to the major axis shown as a red line.
|
Note: |
The density units for mean, standard deviation, maximum value and minimum values vary depending on the modality. For example, CT uses Hounsfield Unit, and PT uses Standard Uptake Values (SUV). To change the SUV correction method, see Change the SUV Correction Method. |
Freehand ROI
A Freehand ROI can be drawn to measure arbitrary points on the image. If you use the freehand ROI to draw an open freehand curve, Synapse measures the length of the freehand annotation.
Standardized Uptake Value
A Standardized Uptake Value (SUV) represents a quantitative measurement for relative tissue uptake of a radio tracer in Positron Emission Tomography (PET) images. SUVs are calculated based on the data contained in the image's DICOM tags and are calculated for most PET images.
Synapse correlates the SUV for a patient according to the specified SUV correction method (see Configuring Annotations Settings).